Statistical Reports
The statistical reports allow you to track your students’ progress and assess their performance.
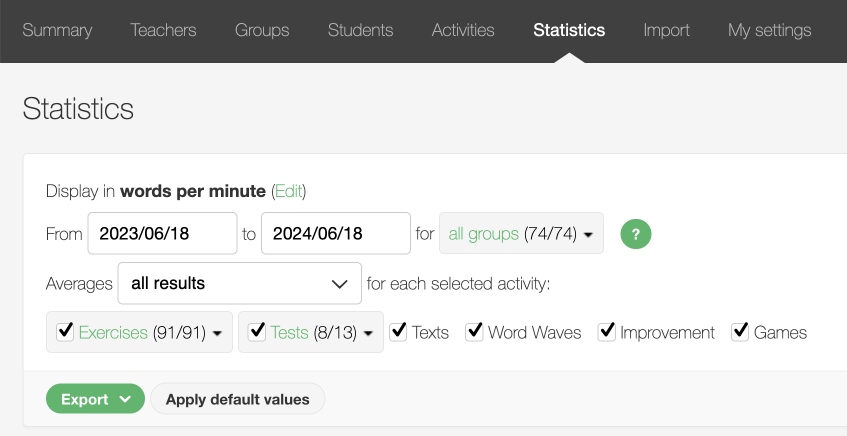
Criteria for Calculating Averages
The Statistics tab shows all possible criteria for calculating averages before they are exported. The period covered may not exceed one year. By default, the most recent date corresponds to when the last activity was completed.
Averages are calculated based on one of the three following filters:
- Last result: Statistics are calculated using the most recent result obtained for each selected activity. All other results for the same activity are ignored.
- Best result: Statistics are calculated according to the fastest time for each selected activity. If two results for the same activity show the same speed, the result with the best accuracy will be recorded. If two results for the same activity show the same speed and accuracy, the more recent result will be recorded.
- All results: Statistics are calculated using all results for each selected activity.
Advice—For a summative evaluation select only relevant activities, such as the final test and timed tests. The average will then be representative of the performance that the students have actually achieved.
Note—Statistics, averages and detailed results vary according to the selected activities (exercises, tests, texts) and the other criteria chosen. Automatic grading (A+, 100 %, Excellent, etc.) can be enabled and configured in the Grading panel.
Reports for a School, Group or Teacher
Depending on its location, the Statistics tab provides access to different sets of data:
- School statistics allow you to export a report on the students in all the groups of a school.
- Teacher statistics allow you to display and export a report on the students in all the groups of a particular teacher.
- Group statistics allow you to display and export a report on the students in a particular group.
Detailed Results
Detailed student results
To see a student’s detailed results, you have two choices:
- Detailed statistics: Access a student’s detailed statistics and grades, if any, by clicking his or her name within any report. You will then be given more options, allowing you to select the relevant data for calculating the student’s average.
- Student log: Access all recorded activities from the Log tab of the student’s account. This will give you access to the video replays and the data just as the student sees them in his or her account.
Detailed results for multiple students
- Go to the Statistics of a Group.
- Click the Export button.
- For the report type, select the Detailed results option and the file format that you want.
- Click Export to download the report file.
Unit of Measure for Displayed Results
- Access your Settings by clicking your name in the top right corner of the window.
- Click the Display section.
- Select the unit of measure in which the results are to be displayed, and then click the Save button.
Report for Parents
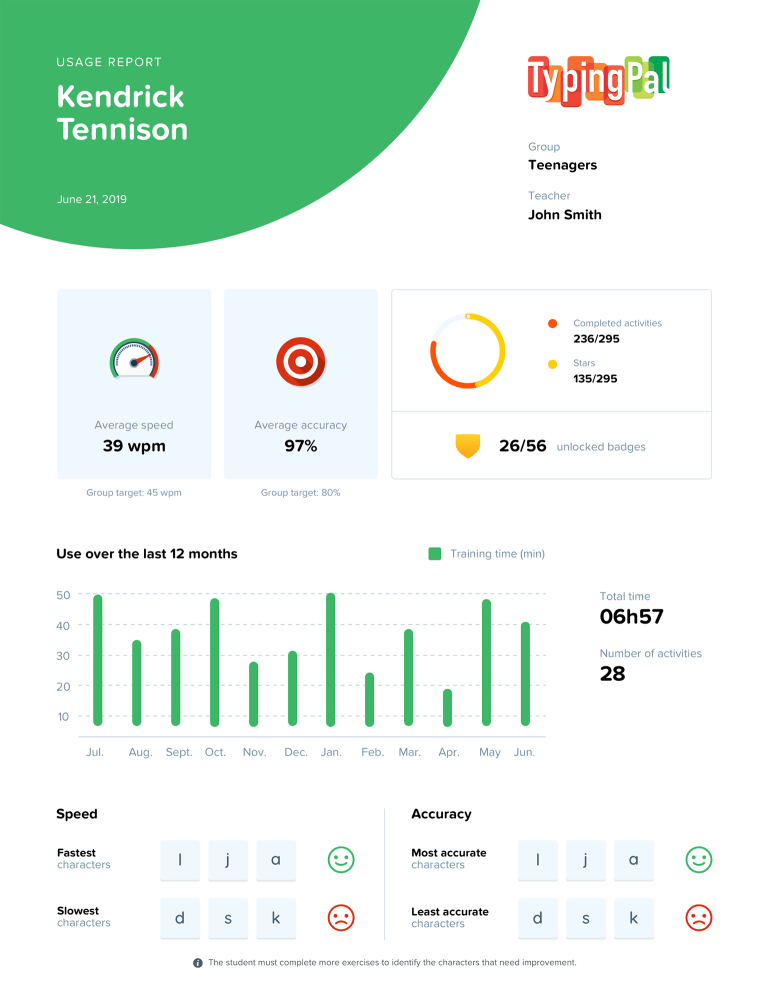
Parents are invaluable allies when it comes to encouraging students to persevere. This is why Typing Pal includes the option to generate a PDF report to provide parents with data on their child’s engagement and performance.
You can generate this report for a single student or for all the students in a group:
- Go to the Student Summary or the Group Summary page.
- Select Get report or Get reports from the Actions menu.